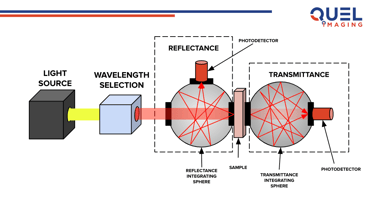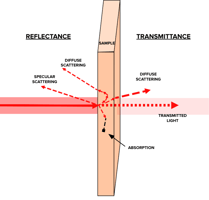
We discussed before how raw reflectance and transmittance spectra provide a story of a photon's...
When light travels through air or space, it moves unimaginably fast—circling the Earth about seven times per second. But inside tissue, light behaves differently - it travels about half as fast while scattering, diffusing, and absorbing.
Measuring those subtle changes in speed—how long it actually takes light to travel through a material—is the principle behind time-of-flight (ToF) measurements. In tissue-simulating materials, ToF analysis provides a way to quantify light speed (i.e., refractive index), scattering, and absorption revealing how optical signals behave in biological environments.
But how does ToF work in practice? Why should we use it? And how does it compare to spectrophotometry?
Today, we are going to discuss how time-of-flight (ToF) measurements work and how our team uses time-of-flight data to calculate material optical properties.
Time-of-Flight Overview
We all know the speed of light, in concept - extremely fast. When light travels into different materials, it tends to slow down a bit. The material’s refractive index (n) tells us exactly how much it slows down compared to light in empty space. Time-of-flight measurements work by measuring the delay in light arriving at a detector once travelled through a given material, much like timing a race.
To do this, ToF instruments use a short pulsed illumination source with adjustable color (e.g., multiple lasers, filtered supercontinuum lasers). Timing these pulses requires photodetectors and computers equipped with high-speed timing electronics to measure extremely short changes in photon arrival time on the order of picoseconds (i.e., 1/1,000,000,000,000 of a second). Comparing photon arrival times at our detector with and without a sample in the path, plus a little bit of math, makes calculating photon arrival times relatively straightforward.
TOF Data Output
Practically, when we take these measurements, we see a few different groups of photons hitting our detector.
Our reference measurement tells us photon times of arrival from our illumination source without traveling through a sample. We look for the strongest, earliest peak arriving at our sample to calibrate photon travel times in the measurement system.
Placing our sample in the instrument, the photon arrival at the detector delays and broadens. The fastest group of photons hitting our detector first are the transmitted photons that avoid scattering within our sample. When we know our precise sample thickness, the transmitted photon arrival time let us calculate the refractive index (n) of the sample at the set illumination wavelength.
After the initial group of photons, we see an long-tail group of photons arrive at the detector which have undergone scattering in the sample. The distribution of arrival times at the detector let us calculate the reduced scattering coefficient (µs’) of the sample - which amounts to the average path a photon travels through a sample when it is scattered. Scattered photon path length increases are mathematically predictable, thus we can simplify the scattering properties into a single reduced scattering coefficient to accurately model photon transport in our sample.
Further, we can integrate the total light arriving at the detector - independent of time - to measure how many photons were absorbed in the sample. Knowing the sample geometry lets us calculate our sample’s absorption coefficient (µa) as the average path length a photon travels in a sample before it absorbs.
These measurements are repeated across the illumination wavelengths of interest - which we can cross-reference to our spectrophotometry measurements.
At the end of measurement, we have a straightforward measurement of sample optical properties:
- Reduced Scattering Coefficient, µs’
- Refractive Index, n
- Absorption Coefficient, µa
Spectrophotometry Comparison
We discussed earlier what methods exist for optical property characterization. Spectrophotometry and TOF are the generally accepted gold-standard methods of optical property characterization. But each has their own benefits and drawbacks.
ToF spectroscopy is a powerful technique for measuring optical properties with a strong application history in literature - similarly to spectrophotometry. Most notably, it offers a direct physical measurement absorption, scattering, and refractive index with some basic mathematical operations.
Spectrophotometry assumes a sample’s refractive index and anisotropy to numerically simulate absorption and scattering properties that match reflectance and transmission data. This adds more opportunities for uncertainty to propagate in optical property calculations. ToF measures refractive index directly. Arguably, ToF offers a more direct physical measurement modality for optical properties. Neither ToF nor spectroscopy can measure anisotropy without extended optomechanical functionality.
Despite this, ToF presents some practical drawbacks:
Limited sample geometries - ToF requires very specific sample preparations to make accurate measurements. If samples are too thin, the instrument will not clock delayed photon arrival times accurately. If samples are too thick, multiple scattering begins to increase the reduced scattering coefficient. As a result, TOF tends to be more prone to sample preparation variability than spectrophotometry. We are able to compensate for this with a similar methodology to IAD in spectrophotometry.
Measurement Time - since TOF requires broadband, tunable pulsed laser sources for spectroscopic capabilities, spectral scanning, time synchronization, and detector gain adjustments result in measurements taking several minutes for a single wavelength. This can make spectral measurements challenging.
Cost - The source and detection electronics for a ToF system with spectroscopic tunability add significant time and cost to ToF measurement systems.
Commercial Availability - There are not as many commercially available ToF systems available. At QUEL, we have turned to using a well-characterized custom built instrument to meet our customer’s needs.
Our team relies on both ToF and Spectrophotometry for optical characterization because the complimentary data helps maintain consistency and rigor in our material formulation processes. We are fortunate to have both capabilities in house (and others) to provide a rigorous analytical basis for all of our phantoms and targets.
Different applications may call for different approaches. Our team is here to help you navigate those challenges. Nonetheless, we are here to help your team understand whether ToF or Spectrophotometry is the right approach for your projects.
—--
Our team has decades of combined tissue optics expertise to help your team build the phantoms you need to accelerate your product development processes. Learn more about how QUEL can help your team out by getting in touch.